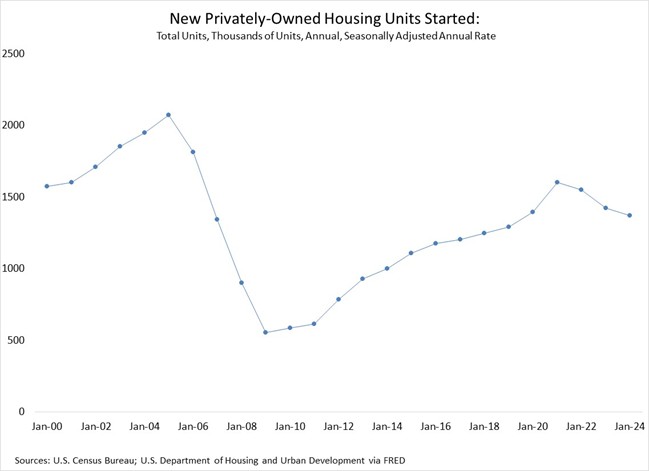
The lumber industry lives and breathes housing starts. Of course, it is always rooting for higher numbers and lamenting lower ones. Everyone becomes attuned to the big drivers of the ‘big number’. Industry participants and investors can talk carefully to the demographics and the financial drivers. Lower mortgages are celebrated because they will allow buyers to finance more expensive homes with the same monthly payments. More expensive homes can absorb more lumber at a higher price pushing up that top line revenue for the industry, and everyone benefits. However, not everyone benefits equally from the good times or suffers as much during the downturns. Intuitively, everyone understands that there is a difference in performance, but no one really thinks that they are the laggard of the industry. How could they be?
Well, someone has to lead the race, and someone else has to be running behind them. In theory, every business should be benchmarking itself against its competitors. In practice, it is difficult because no other business is exactly like yours with its location and attributes. Lumber is a commodity business with many ways of differentiating itself. Elements like speed of service, logistics, inventory availability combine to make a piece of lumber unique to the buyer. What the buyer cares about and is willing to pay for are big drivers of the performance within the commodity business. The following chart shows the historical rates of return on assets in lumber manufacturing for the last 14 years.
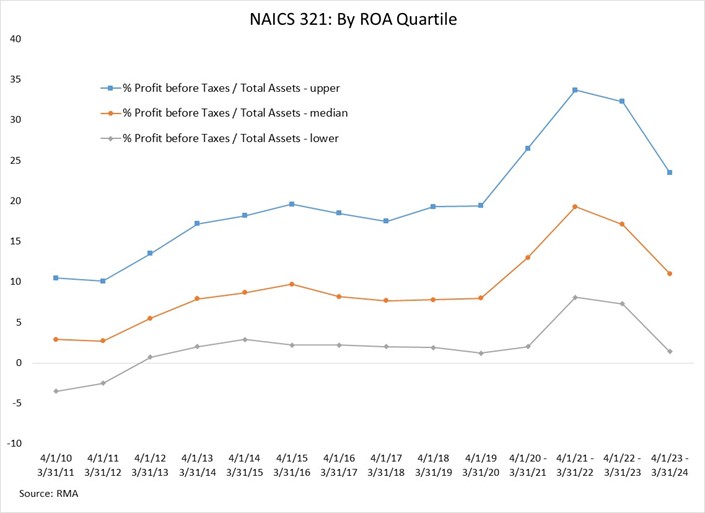
Let’s take a careful look at the graph to see what light it brings to the situation, and we should note its limitations as well. Does it help us see the ‘trend, cycles and events’ of the industry? First off, it passes the sniff test of making sense with how the industry ‘feels’ about the situation. The long climb out of the doldrums of the 2008 and 2009 housing crisis lifted the returns for everyone who had survived that industry crash. Yet, not everyone survived because the database shows a sharp drop in industry participants at every link in the homebuilding industry. Let’s just call surviving the ‘survivors’ dividend’ which allowed your business to take another shot at making money in better times. It also shows the recent boom times of 2021 to early 2023 with the sharp jump in homebuilding and historically high lumber prices. Anyways, it certainly shows the recent slump in demand and profitability across the sector.
It also shows the very surprising gap in returns over that 14-year period of ups and downs. The top quartile averaged 20 percent returns on assets. The median managed an average of 9 percent, and the bottom quartile only received an average return of 2 percent. A couple of very important questions immediately spring to mind. Do companies always stay on ‘their line’? Said in another way, are the great companies always great and the bad always bad? The answer is no they aren’t always great or bad, but they have a tendency to be in those groups while dealing with incidents. I think a good analogy are sporting franchises. Even with shared revenue and draft mechanisms to help the weaker franchises, we see the same teams on top of the league for decades at a time. That doesn’t mean that the powerhouses don’t have rebuilding years, or a weaker team doesn’t have a standout season. There are lots of intangibles, but the league leading teams have great management and ownership.
It is fair to end with a critic of the limitation of benchmarking. Many times, when a company finds itself on the low end of the benchmark, they point out that they have significant differences from the other companies that are in the grouping. It is tough to find a completely ‘apples to apples’ grouping for many companies. That should temper any criticisms from a benchmarking with a careful acknowledgement of the limits. However, if you feel economic pressure from your competitors, it means that they are sufficiently like you in their products and services to impact your financial performance. Even though they might not look like you in a business sense they are your competition. That means that they should be in your benchmarking group. So make a careful list of the competitors that impact your business, and try to get your financial service provider to make an appropriate benchmark. Everyone likes the scale when it shows the weight they were hoping for, but it isn’t the scale’s fault if it doesn’t.
Mortgage rates and demographics will do what they will, and no one is going to predict them over the long-term. Sometimes the economic winds will blow in your face and other times at your back. Just make sure your boat is ready, and you and your team are ready to sail in any conditions to make the journey work. Think about the rewards for being good. A top tier company with an average return of 20 percent on assets will thrive, and it will be offered more assets to manage. The bottom tier is marking time until they exit. Maybe they have a plan to exit, but they are on the exit ramp even if they don’t acknowledge. It is your job to make sure you know where you stand.